Economic Analysis
Analysis and reports on agricultural data and market updates
-
At the Commodity Classic and the National Farmers Union Convention last month, one theme stood out above all others: the strain on today’s agricultural economy. Headlines and USDA reports tell the same story – grain prices are under pressure, input costs are at record high, and farm financial stress is rising.
In this environment, profitability doesn’t come easy. And farmers have to be more intentional than ever, looking for every opportunity to reduce costs and improve returns. As one producer told me in San Antonio, “we can’t be lazy when there is $4 corn.”
One of the most effective ways to understand where profits are being made – or lost – is to dig into the data. Minnesota is uniquely positioned in this regard. The University of Minnesota’s Center for Farm Financial Management maintains one of the most robust farm-level datasets in the country through its FINBIN database. Using five years of FINBIN records (2020-2024), we can analyze farm finances across different production types. For this analysis, we’ll look at corn and soybean enterprises across the state by profitability quintiles: the lowest profitability enterprises in the data (bottom 20%), middle low (20-40%), middle (40-60%), mid-high (60-80%), and the highest profitable enterprises (top 20%). A forthcoming Part 2 of this post will look at costs of production, but here we look at the characteristics of farm outputs and size.
Of course, no dataset tells the full story, just like no two farms are the same. Individual farm outcomes vary widely from year to year. Management decisions change, crop rotations shift, marketing strategies differ, and weather remains unpredictable. These results should not be interpreted as a prescription for success. However, they do provide valuable insight into the characteristics that tend to separate higher- and lower-profit farms.
Three Key Findings Emerge:
- Yield is the dominant driver of profitability
- Higher-profit farms tend to receive better prices
- Larger farm-size does not determine higher profitability
Yield is the primary factor
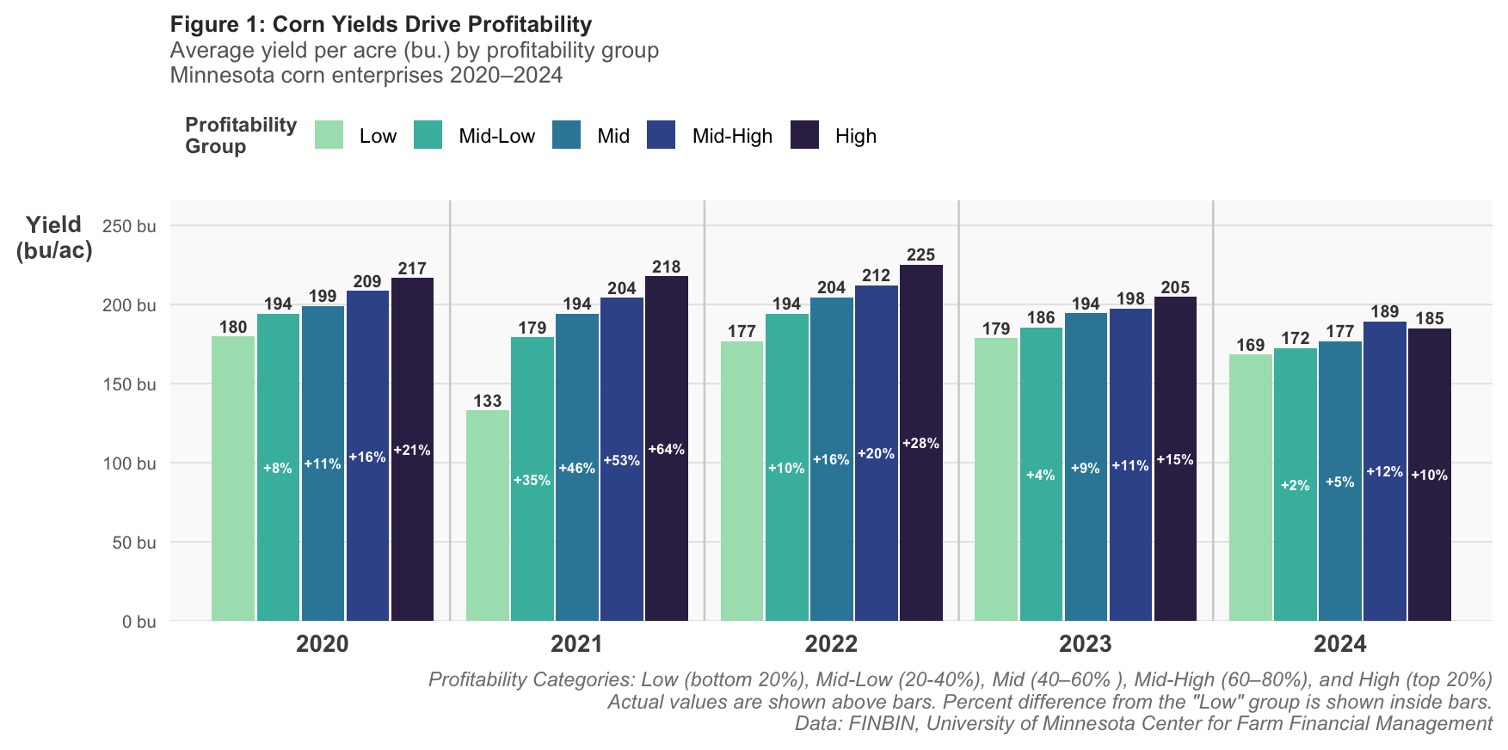
Yield stands out as the single most important driver of profitability (Figure 1). While this may seem obvious, the magnitude is notable – yield explains over 45% of the profit gap between the highest and lowest-performing farms. For corn, the spread between the top and bottom quintiles has ranged from roughly 35 to 50 bushels per acre, year over year. Weather, geography, and inherent soil certainly influence yield and are largely outside a producer’s control. Nonetheless, the consistency of this yield gap across five years, across varying weather conditions, points to management playing a meaningful role alongside those structural factors. This raises important questions about managing marginal land and identifying opportunities to improve agronomic efficiency across operations.

Figure 1: Yields (bu/ac) of MN corn enterprises (2020-2024), broken out by profitability group.
Marketing matters
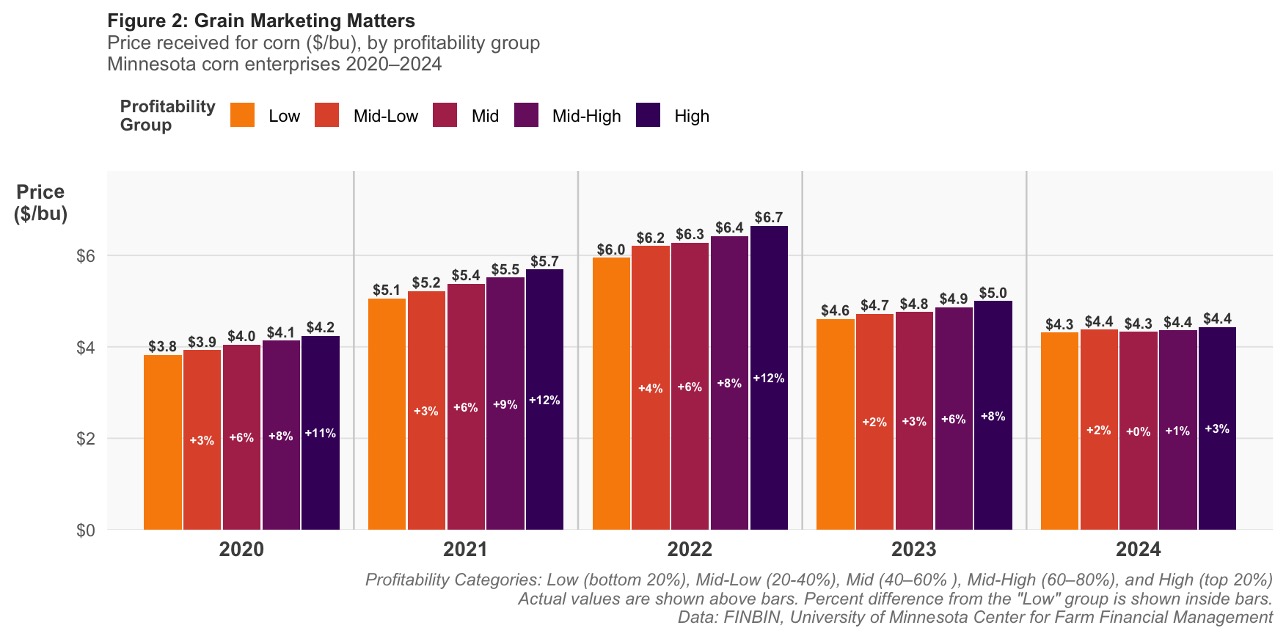
Higher-profit farms consistently receive better prices for corn. Although the impact on profitability is smaller than yield, it remains meaningful. Higher prices captured by more profitable farms accounts for roughly 15% of the profitability gap between the top and bottom groups. This suggests that marketing strategy, timing, and possibly access to different buyers or contracts can play a measurable role in farm performance. What strategies are taken for forward contracting, basis management, or farmers’ access to premium markets isn’t fully captured in this data. But the consistency of the premium across all five years suggests it isn’t random. Marketing strategy, timing, and access to buyers all appear to play a measurable role – and though the gap narrows, it persists even in years when overall corn prices are compressed.

Figure 2: Corn prices received in Minnesota (2020-2024), broken out by profitability group.
Scale doesn’t predict profitability
One notable finding in the MN FINBIN enterprises is that size is not a driver of profitability. In every year, both in corn and soybeans (Figures 3 and 4), higher-profit farms are not consistently larger. Scale can help with efficiency, it can lower per-unit costs on some inputs and shouldn’t be dismissed. But in the FINBIN data, it doesn’t translate into consistently higher profit. What the top-performing farms share is performance on the acre, not how many acres they have. This challenges a common assumption that “getting bigger” is the path to financial resilience. It may be one path, under the right conditions. But the farms at the top of the profitability distribution are there because of what they do on their acres – not how many acres they manage.
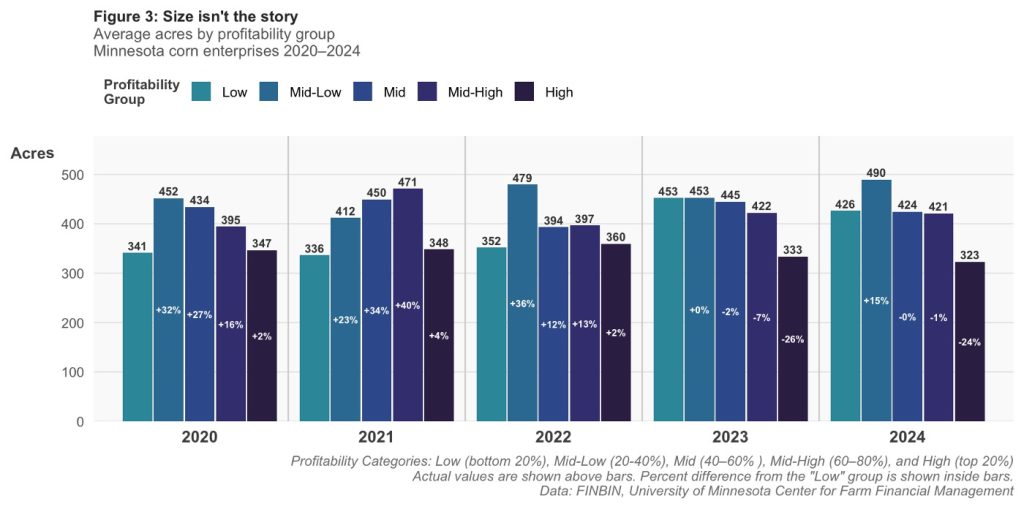
Figure 3: Size (acres) of Minnesota corn enterprises (2020-2024), broken out by profitability group.
Soybeans tell a similar story
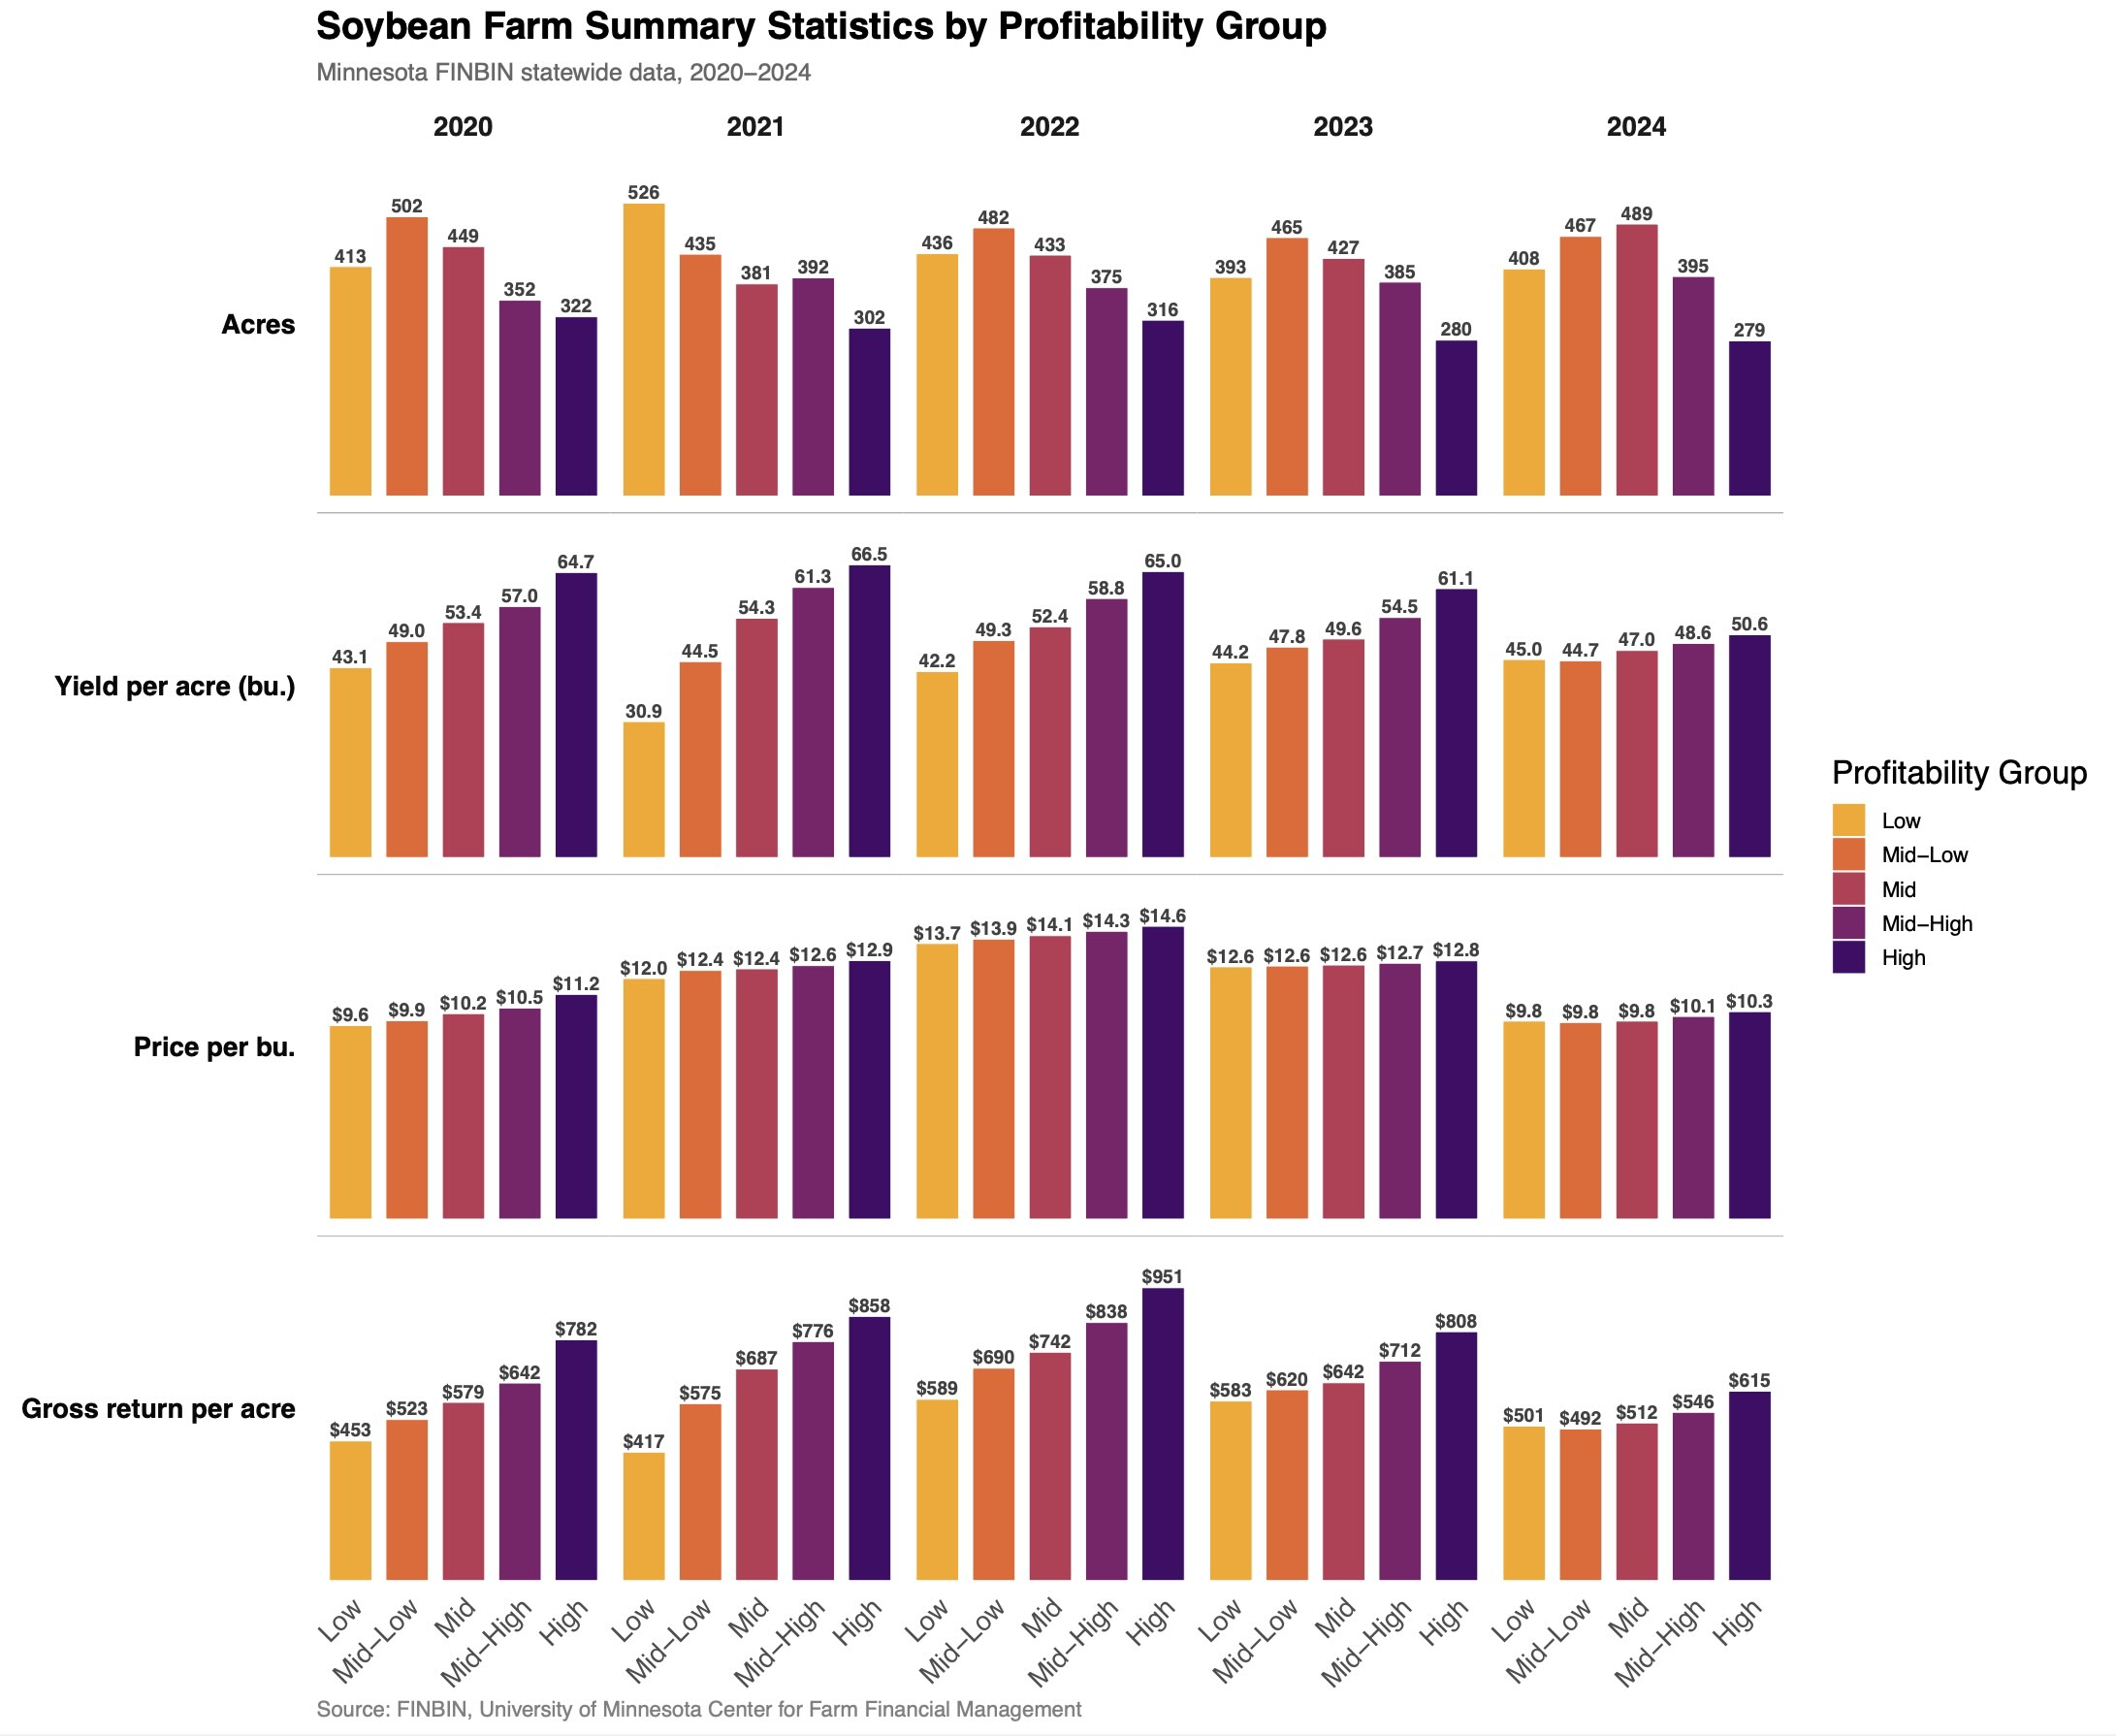
For soybeans, yield again emerges as the dominant factor (Figure 4) – and in many cases, the spread between low and high-profit farms is even more pronounced than in corn. Differences in soybean yields across profitability groups are large and consistent across years, driving a substantial share of the gap in returns per acre.
In contrast, differences in price received for soybeans are generally smaller than in corn. While higher-profit farms still tend to receive slightly better prices, the range is tighter. As a result, yield accounts for a larger share of the profitability differences in soybeans, while marketing plays a somewhat smaller – though still important – role.

Figure 4: Minnesota Soybean Enterprises: size (acres), yield (bu/ac), Price ($/bu), and gross returns per acre ($/ac) for (2020-2024), broken out by profitability group
In summary and what questions remain
Taken together, these results point to yield as the primary driver of profitability, followed by price, while size plays a much smaller role. Not all of these factors are within a producer’s control – weather, soil, and location matter. Nonetheless, the consistent differences across farms suggest management decisions still play a meaningful role. In a tighter-margin environment, the corn and soybean farms that perform best are not necessarily the biggest, but those that execute well where it counts – maintaining strong yields, capturing better prices, and allocating resources effectively.
This is the first blog post analyzing Minnesota’s FINBIN data and it is only scratching the surface of what this dataset can help us understand. These results are about the revenue side. But a farm’s profitability is also shaped by what it spends – input costs, labor, land, equipment. This will be the subject of Part 2, which will look at the cost side of the FINBIN data: what high- and low-profit farms spend differently, where the efficiency gaps are, and what cost-per-bushel looks like across quintiles. And of course, Minnesota farmers operate across different scales and types of production. If you have questions or thoughts about what future analysis could help us understand, please do reach out.
-
The Iran conflict continues to evolve rapidly. With the closure of the Strait of Hormuz (Associated Press 3/11) and attacks on both Iran and Qatar’s gas production facilities (NYTimes 3/18) international oil prices have soared. March Brent Crude oil prices have averaged over $98 a barrel – a 37% increase over February. Asian LNG markets have also risen sharply, though U.S. LNG prices have remained relatively stable (EIA, 3/10), largely because domestic supply and export capacity were already high.
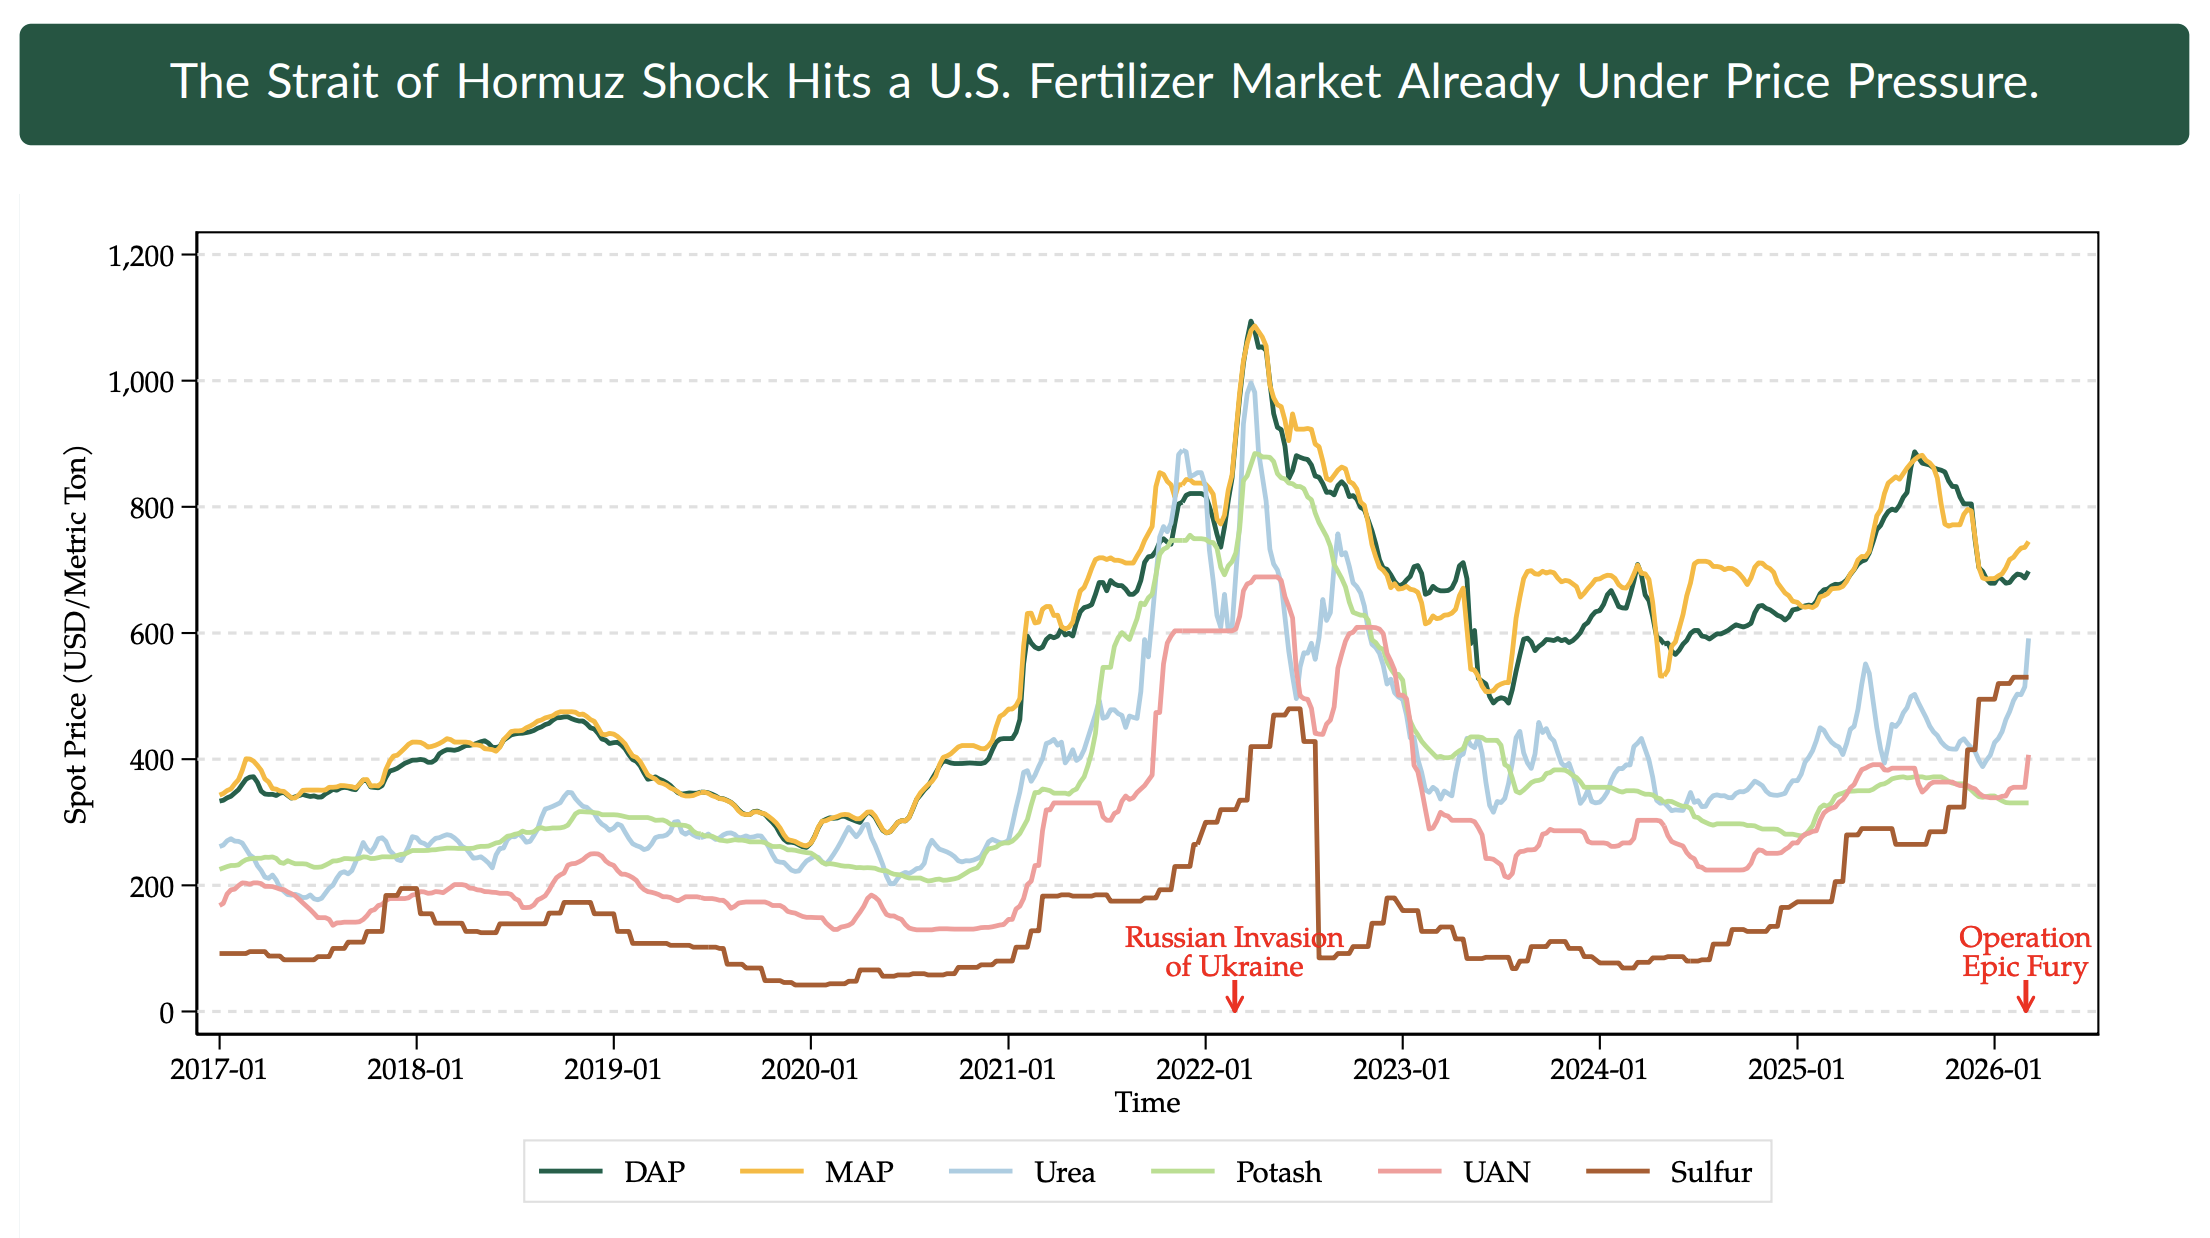
Agricultural production expenses had already been projected to be at a historic high for 2026 (ERS 2/5). Thus, the potential for further price increases has the agricultural community on alert. Oil and gas are directly and indirectly essential agriculture inputs. Directly, fuel is an important piece of a farm operations itself – accounting for about 3.5% of total input costs in Minnesota corn production, or roughly $30 per acre. Indirectly, fertilizer prices are closely linked to natural gas markets and often represent the largest single expense in row-crop systems, making up about 20% of total input costs in Minnesota corn production. We are currently seeing retail fertilizer prices increase. Urea is 11% higher than a month ago and Anhydrous is 8% more expensive relative to last month (DTN 3/25). The U.S. currently produces roughly 80% of nitrogen fertilizer domestically (ERS 2025), thus we don’t expect to see as big of a shock to fertilizer costs as Asian markets. Nonetheless, the increase in fertilizer expense for what was already the most expensive item on the balance sheet is expected to add further pressure to farm profitability.
In acknowledgement of both the current conflict and the uptick in fertilizer costs over the last decade, Senator Klobuchar, joined by Senators Thune and Marshall, introduced bipartisan legislation aimed at increasing fertilizer price transparency and lowering fertilizer costs creating mandatory price reporting.
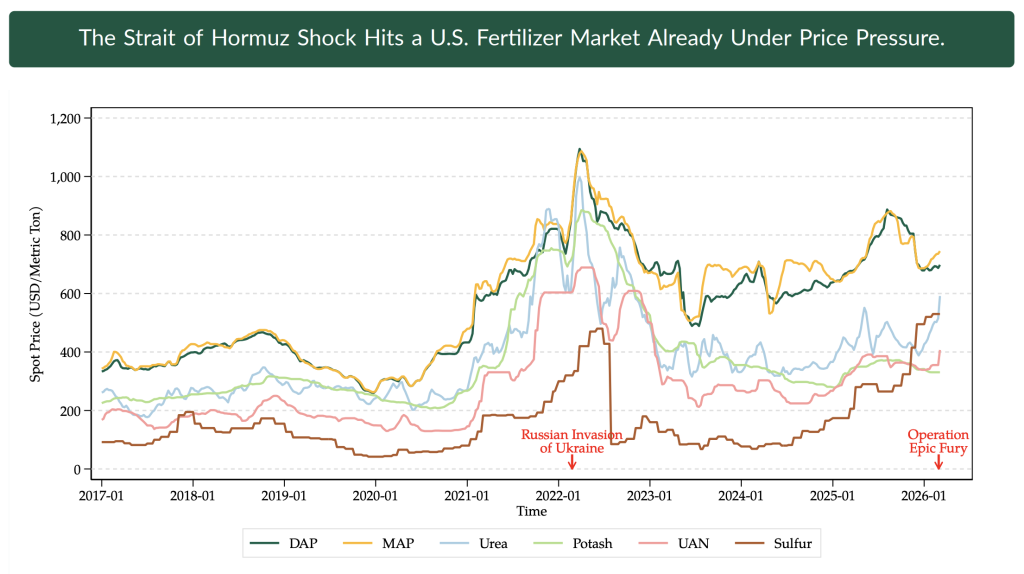
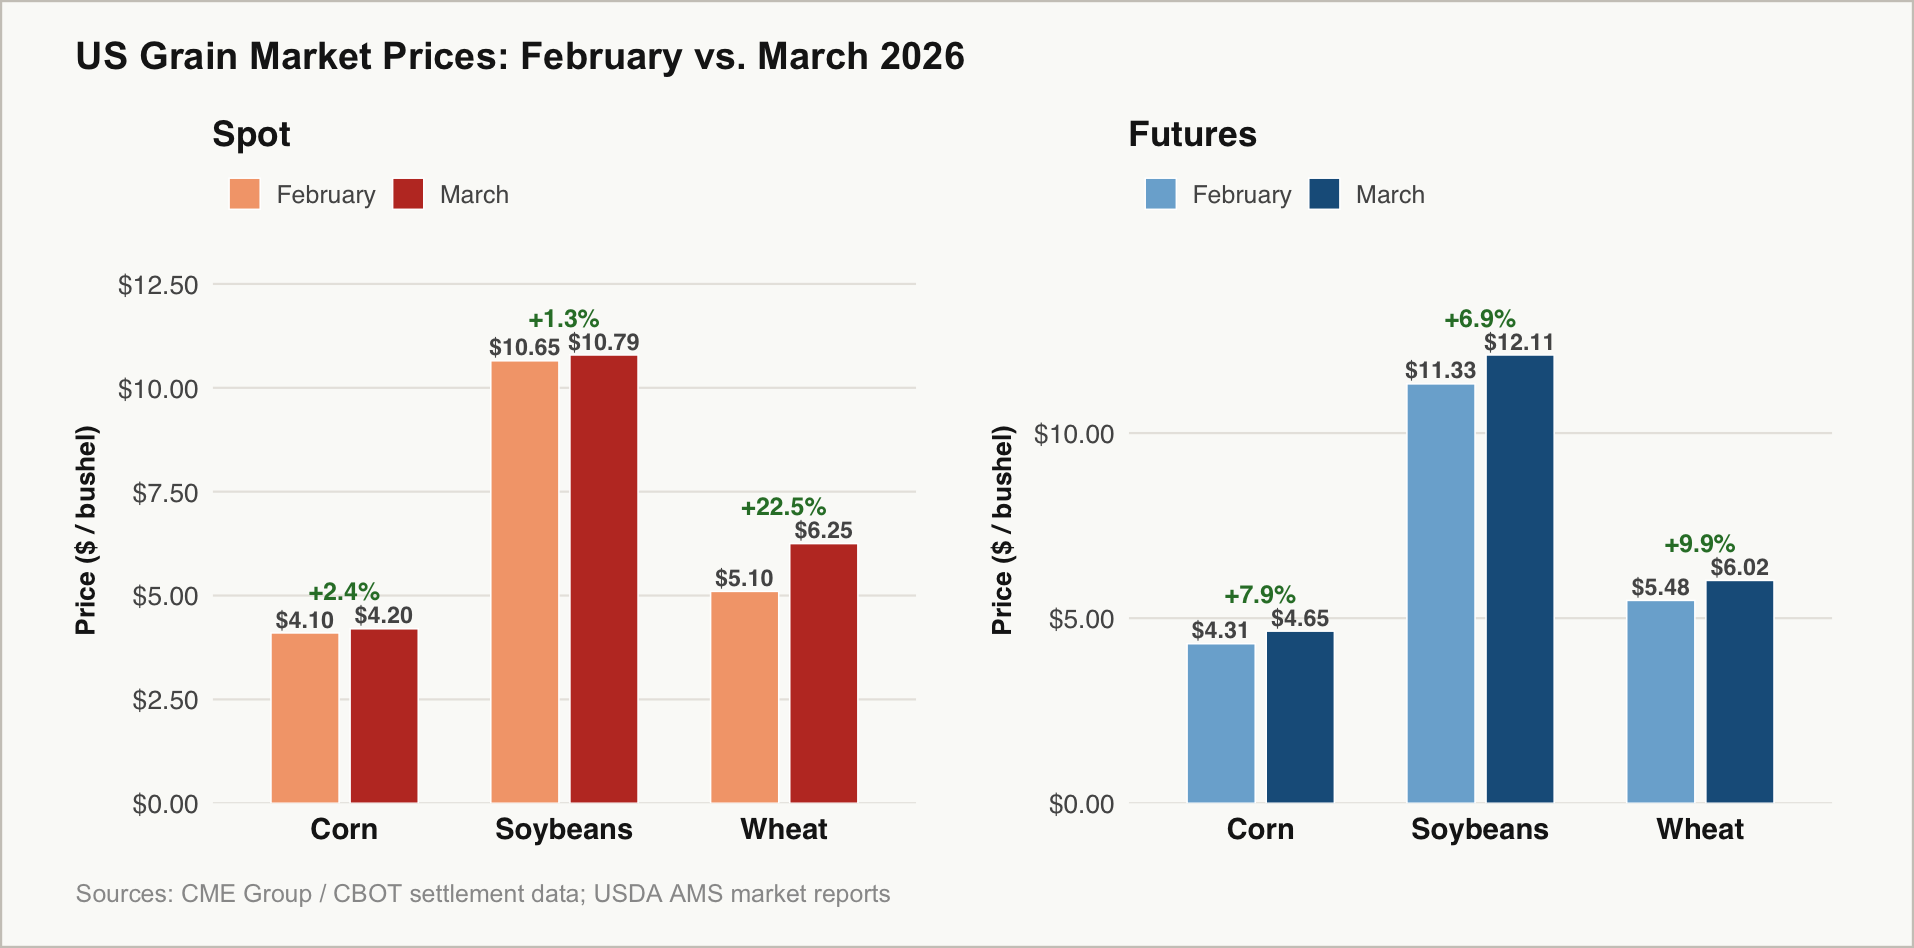
Figure 1: Fertilizer Spot Prices on the U.S. Gulf Coast. (NDSU Agricultural Trade Monitor, using data from Bloomberg) Finally, grain markets are beginning to respond, driven by expectations of higher production costs, tighter supply conditions, and possible trade disruptions. Over the coming weeks and months, prices will be influenced by transportation costs, shifts in global commodity supply, and rising agricultural production costs outside North America. March brought a broad upward move in grain markets, but the biggest immediate strength was in wheat, while corn and soybeans showed more of their strength in the futures market than in spot cash prices (Figure 2). That said, futures markets reflect speculations. Much will depend on how the conflict develops, whether supply disruptions persist, and how producers and traders adjust over the rest of the year.
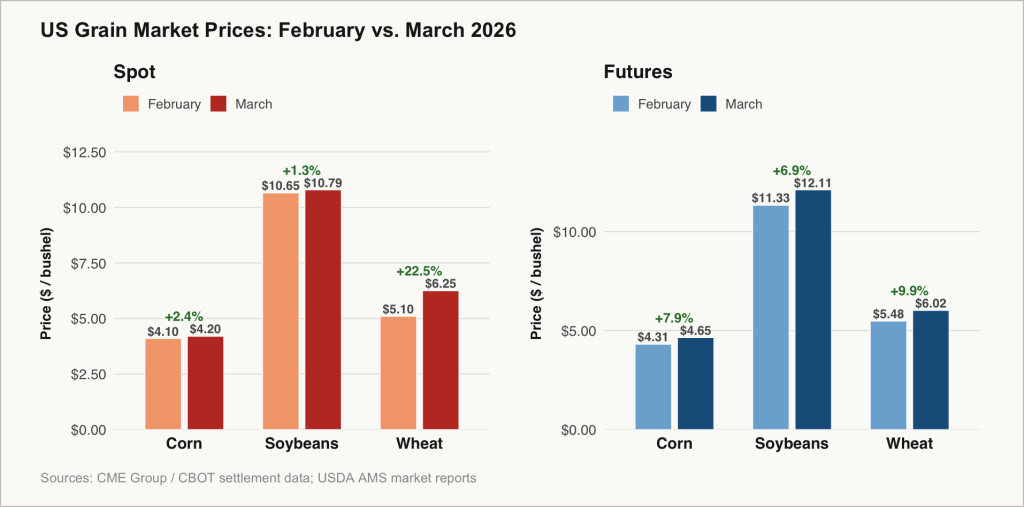
Figure 2: US Grain Markets for Corn, Soybeans, and Wheat (February-March, 2026) -
New USDA National Agricultural Statistics Service(NASS) data has been released from the Tenure, Ownership, and Transition of Agricultural Land survey. As reported by Todd Neeley in Progressive Farmer, 80% of the national rented farmland is owned by non-farmers, and a mere 5% of existing farmland is expected to transfer ownership in the next 5 years.
The data does not provide state-specific information, but it does provide region-level statistics, which I’ve analyzed for the Midwest. Here in the Midwest, we see that 346,000 farmland landlords (50.2% of farmland landlords) have never farmed – owning 23.8 million acres – while 37.1% of landlords are retired from farming and 12.7% are actively farming.
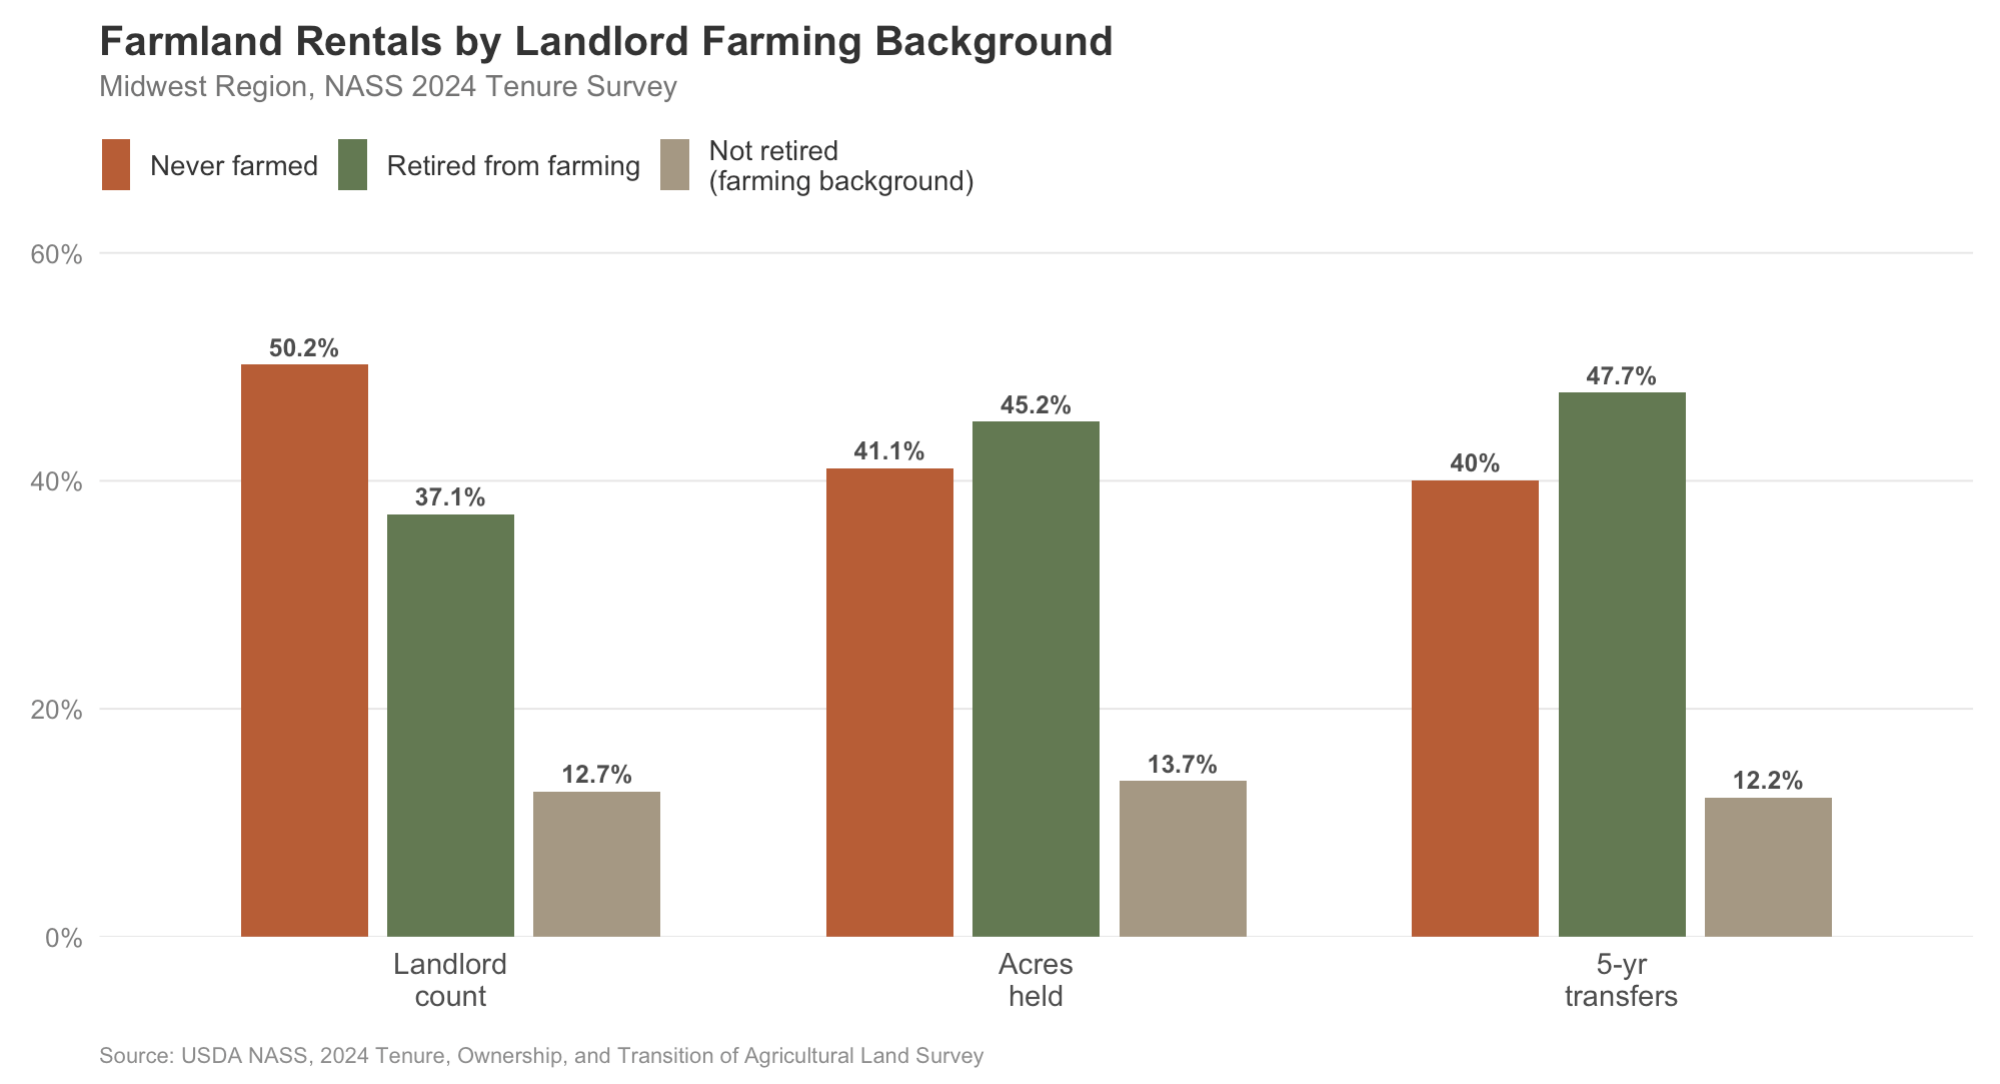
Figure 1: Farmland Rentals by Landlord Farming Background (2024)
We also learn that 18 million acres in the Midwest are expected to change hands in the next 5 years. However, few of these acres are going to be openly for sale, with 86% going into trust. 10% of the expected transferred acres over the next 5 years (or 1.87million acres) will be openly for sale, and the remaining 4 percent will be for sale to family members.
Finally, the data shows that midwestern farmland rentals are primarily structured as fixed cash leases, and share leases – which tie rent to yield – cover only 14% of acres. Most of the tenants are long term, with only 19.9% of the tenants having been with the landlord less than 5 years – suggesting stable (and relatively illiquid) lease markets that do not shift frequently.
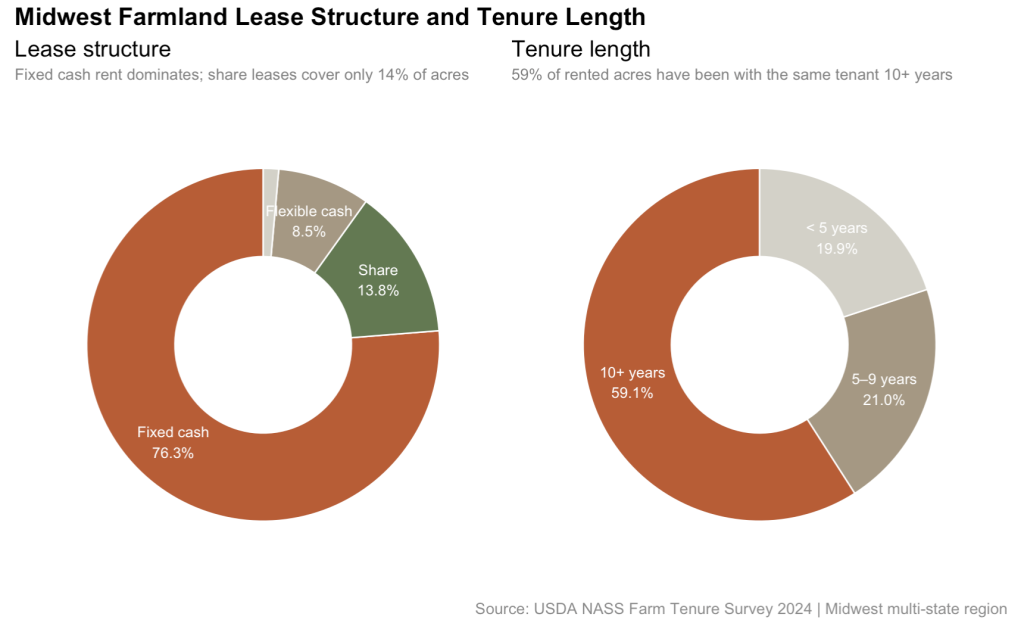
Figure 2: Midwest Farmland Lease Structure and Tenure Length (2024)
Minnesota’s corporate farm law notably keeps corporations from owning farmland. However, MFU has continued pushing for more action on land prices, including through recent testimony from Vice President Anne Schwagerl on a bill to require a Minnesota land trends report.
“I’ve even seen ads on Facebook and Instagram saying things like, ‘Invest in farmland—you’ll get better returns than the stock market,’” Schwagerl told members of the House Agriculture Committee. “I certainly notice those, and I find them concerning.”