
What three government safety nets meant for MN corn and soybean profitability over the last decade
Minnesota row-crop farmers know that in difficult years, government support can be vital. Ever since the farm crisis of the Great Depression, the U.S. has maintained farm safety nets based on the recognition that prolonged periods of low prices and widespread losses can have consequences that extend beyond a single growing season. Without that support, financial stress can accelerate farm closures and weaken the entire agriculture sector in ways that are difficult to reverse. But the size, source, and role of the support has varied.
Government support in the last decade has largely come through three safety-net channels – i) commodity programs, ii) emergency aid, and iii) crop insurance – each responding to different triggers and risks. Commodity programs make payments when crop prices or farm revenues fall below certain levels. Ad-hoc emergency aid typically responds to major disruptions or events, such as trade disputes, natural disasters, and other extraordinary losses. Crop insurance, meanwhile, protects farmers against losses tied more directly to their yields, revenues, and weather conditions at the farm or regional level and is an individual choice whether to purchase. Who receives support, and how much, can vary widely across farms and years.
In this post, we look at corn and soybean records across Minnesota to examine what role safety net programs play in enterprise profitability. We see that in nearly one-third of the past 20 crop-years in Minnesota, government payments were the difference between a farm that made money and farm that didn’t.
Using FINBIN, the University of Minnesota’s farm financial benchmarking database, this analysis separates the three safety-net channels in Minnesota crop-enterprise data. It asks which channel mattered each year, how much of measured economic loss it covered, and how the result differ across FINBIN’s profitability groups.
Key findings
1. The safety-net assistance changed statewide results in 6 of the 20 crop years. Direct payments alone accounted for 3 of those reversals; the remaining 2 required both direct payments and net crop insurance.
2. Safety net channels are not interchangeable. Commodities and ad hoc programs are direct payments, usually responding to market conditions. Crop insurance is a policy purchased by the farm, with the federal government subsidizing the premium, and payments are tied to insured losses. These programs respond to different risks, reach farmers differently, and distribute public support in different ways.
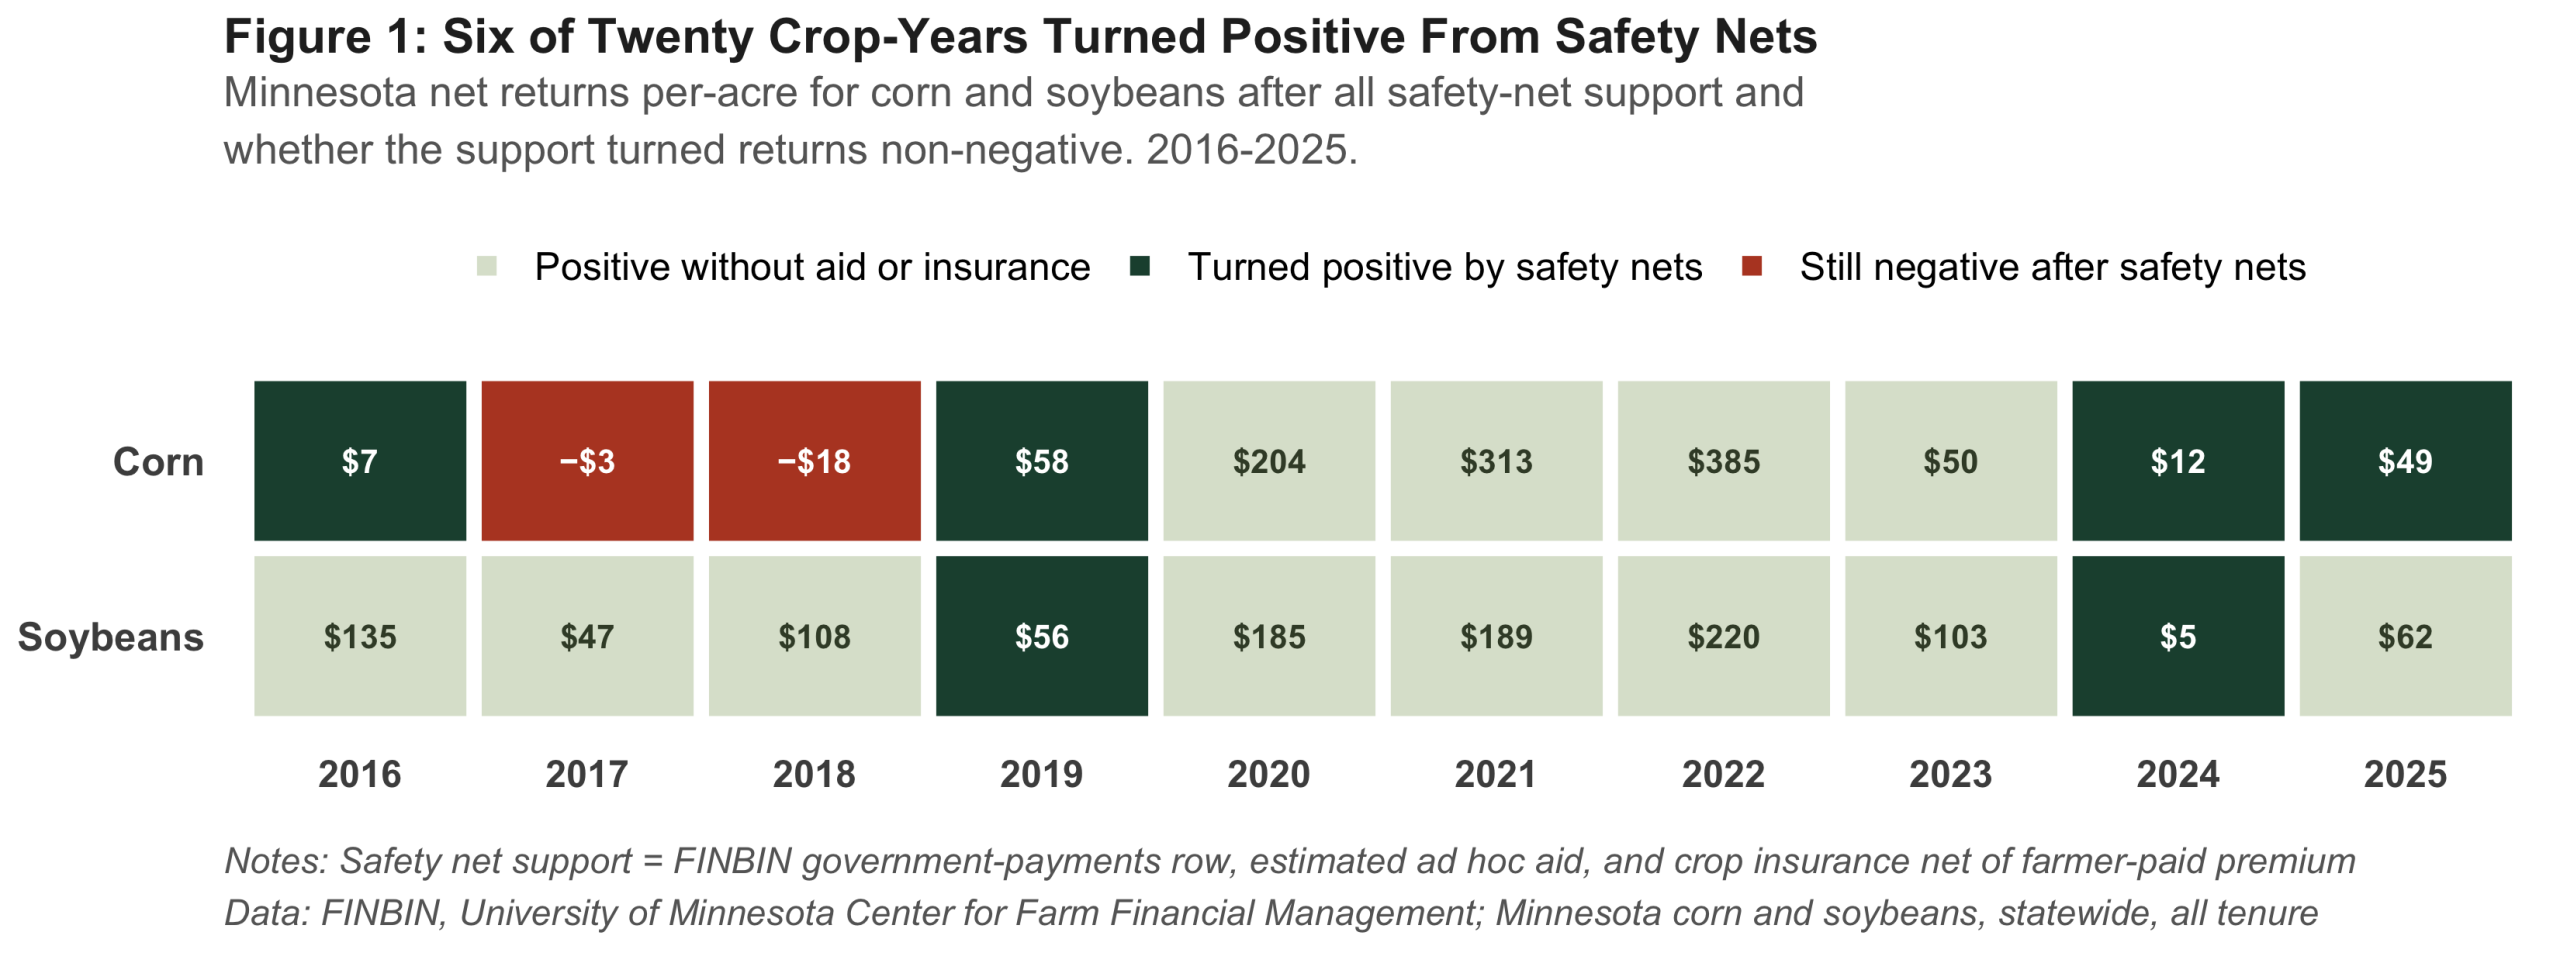
Figure 1: Statewide outcome for each of the 20 crop-years on per-acre net returns, with and without safety-net support
Farm safety-net supports changed the statewide outcomes in six crop years
Farm safety net programs – including farm bill commodity programs, ad hoc assistance, and crop insurance – moved FINBIN net return from negative to nonnegative in 4 out of the last 10 crop years for Minnesota corn, and 2 out of 10 of the last soybean crop years (Figure 1). Corn net-returns flipped to positive in 2016, 2019, 2024, 2025, soybeans in 2019 and 2024. In 2 more corn years, 2017 and 2018, safety net support did not provide enough to flip average returns out of the red. In the remaining 12, state averages net returns were already positive.
Flipping the profitability outcomes for 30% of the crop-years – from negative to positive – shows that these programs can have a significant impact on the viability of family farms. However, the programs that provided support, and the extent to which they changed farm outcomes, varied considerably from year to year.
Direct payments from commodity programs and ad hoc emergency aid
We focus first on direct payments that came in the form of farm bill commodity programs – like Agriculture Risk Coverage (ARC) and Price Loss Coverage (PLC) – and ad-hoc assistance. Notably, not all farms or acres are covered by ARC/PLC. In Minnesota, 68% farmland acres are eligible for the programs (National Sustainable Agriculture Coalition, 2025).
Since 2018, ad hoc assistance has become a larger share of government transfers to agriculture. These have included the Market Facilitation Program in 2018, the Coronavirus Food Assistance Program (CFAP) in 2020, Emergency Commodity Assistance Program (ECAP) in 2025.
| Program | When | What triggered it | What it paid on |
|---|---|---|---|
| ARC-CO / PLC | 2016–17, 2020, otherwise minor | County revenue below a moving benchmark, or marketing-year price below the reference price | 85% of historical base acres; paid the October after the marketing year closes |
| Market Facilitation Program | 2018, 2019 | Retaliatory tariffs | 2018: per bushel ($1.65 soybeans, $0.01 corn). 2019: flat county per-acre rate |
| CFAP | 2020 | Pandemic market disruption | Tiered per-bushel rates across separate production and inventory slices |
| ECAP | 2024 season; paid Mar–Sep 2025 | American Relief Act, 2025 | Flat rates for 2024 planted acres: $42.91 corn, $29.76 soybeans |
| Farmer Bridge Assistance | 2025 season; paid Dec 2025-Feb 2026 | Declared cost-price squeeze | Flat rates for 2025 planted acres: $44.36 corn, $30.88 soybeans |
Figure 2 shows how direct assistance changed profitability outcomes in corn and soybean years. We observe that on average for corn and soybeans in Minnesota farms, government safety nets and ad-hoc assistance minimize losses in years with the lowest net returns. In years with favorable commodity prices and returns, these programs play less of a role in overall profitability but still increase profits. For corn, average returns went from negative to positive in 4 out of 10 years, and the negative returns in 2017 and 2018 were lessened due to direct assistance.