
At the Commodity Classic and the National Farmers Union Convention last month, one theme stood out above all others: the strain on today’s agricultural economy. Headlines and USDA reports tell the same story – grain prices are under pressure, input costs are at record high, and farm financial stress is rising.
In this environment, profitability doesn’t come easy. And farmers have to be more intentional than ever, looking for every opportunity to reduce costs and improve returns. As one producer told me in San Antonio, “we can’t be lazy when there is $4 corn.”
One of the most effective ways to understand where profits are being made – or lost – is to dig into the data. Minnesota is uniquely positioned in this regard. The University of Minnesota’s Center for Farm Financial Management maintains one of the most robust farm-level datasets in the country through its FINBIN database. Using five years of FINBIN records (2020-2024), we can analyze farm finances across different production types. For this analysis, we’ll look at corn and soybean enterprises across the state by profitability quintiles: the lowest profitability enterprises in the data (bottom 20%), middle low (20-40%), middle (40-60%), mid-high (60-80%), and the highest profitable enterprises (top 20%). A forthcoming Part 2 of this post will look at costs of production, but here we look at the characteristics of farm outputs and size.
Of course, no dataset tells the full story, just like no two farms are the same. Individual farm outcomes vary widely from year to year. Management decisions change, crop rotations shift, marketing strategies differ, and weather remains unpredictable. These results should not be interpreted as a prescription for success. However, they do provide valuable insight into the characteristics that tend to separate higher- and lower-profit farms.
Three Key Findings Emerge:
- Yield is the dominant driver of profitability
- Higher-profit farms tend to receive better prices
- Larger farm-size does not determine higher profitability
Yield is the primary factor
Yield stands out as the single most important driver of profitability (Figure 1). While this may seem obvious, the magnitude is notable – yield explains over 45% of the profit gap between the highest and lowest-performing farms. For corn, the spread between the top and bottom quintiles has ranged from roughly 35 to 50 bushels per acre, year over year. Weather, geography, and inherent soil certainly influence yield and are largely outside a producer’s control. Nonetheless, the consistency of this yield gap across five years, across varying weather conditions, points to management playing a meaningful role alongside those structural factors. This raises important questions about managing marginal land and identifying opportunities to improve agronomic efficiency across operations.
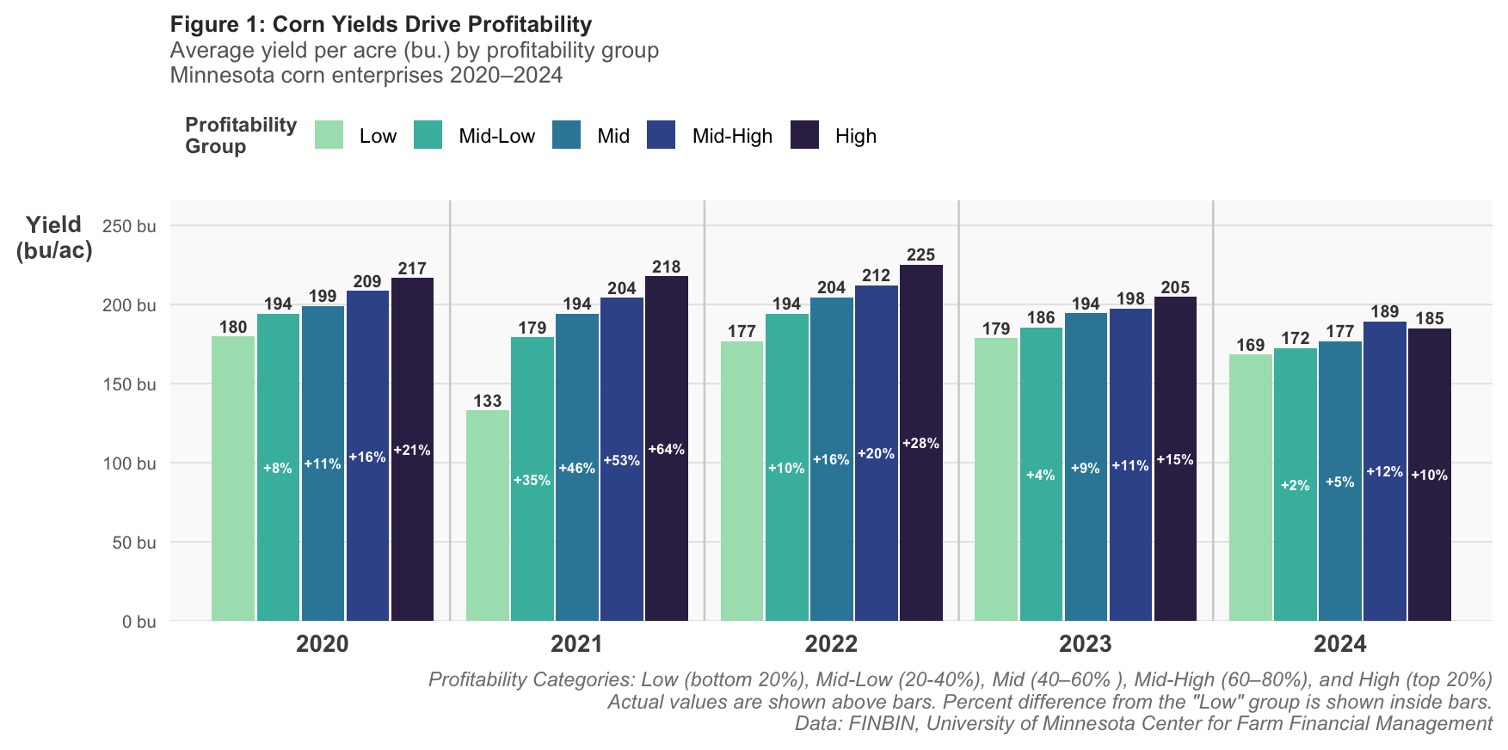
Figure 1: Yields (bu/ac) of MN corn enterprises (2020-2024), broken out by profitability group.
Marketing matters
Higher-profit farms consistently receive better prices for corn. Although the impact on profitability is smaller than yield, it remains meaningful. Higher prices captured by more profitable farms accounts for roughly 15% of the profitability gap between the top and bottom groups. This suggests that marketing strategy, timing, and possibly access to different buyers or contracts can play a measurable role in farm performance. What strategies are taken for forward contracting, basis management, or farmers’ access to premium markets isn’t fully captured in this data. But the consistency of the premium across all five years suggests it isn’t random. Marketing strategy, timing, and access to buyers all appear to play a measurable role – and though the gap narrows, it persists even in years when overall corn prices are compressed.
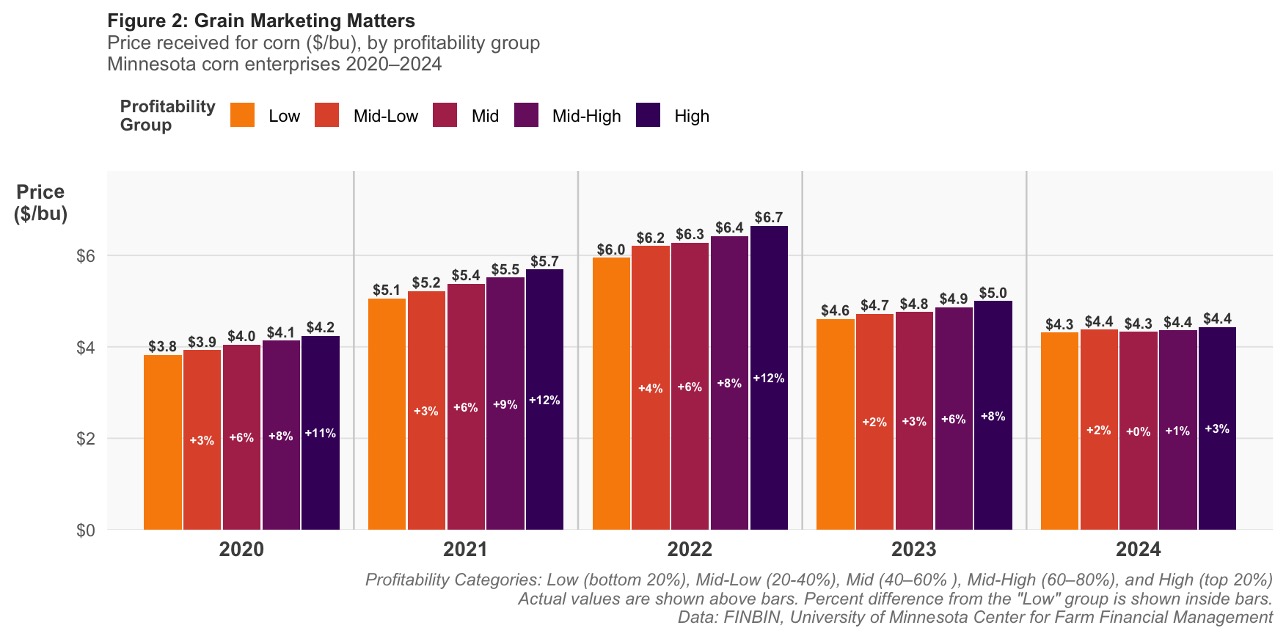
Figure 2: Corn prices received in Minnesota (2020-2024), broken out by profitability group.
Scale doesn’t predict profitability
One notable finding in the MN FINBIN enterprises is that size is not a driver of profitability. In every year, both in corn and soybeans (Figures 3 and 4), higher-profit farms are not consistently larger. Scale can help with efficiency, it can lower per-unit costs on some inputs and shouldn’t be dismissed. But in the FINBIN data, it doesn’t translate into consistently higher profit. What the top-performing farms share is performance on the acre, not how many acres they have. This challenges a common assumption that “getting bigger” is the path to financial resilience. It may be one path, under the right conditions. But the farms at the top of the profitability distribution are there because of what they do on their acres – not how many acres they manage.
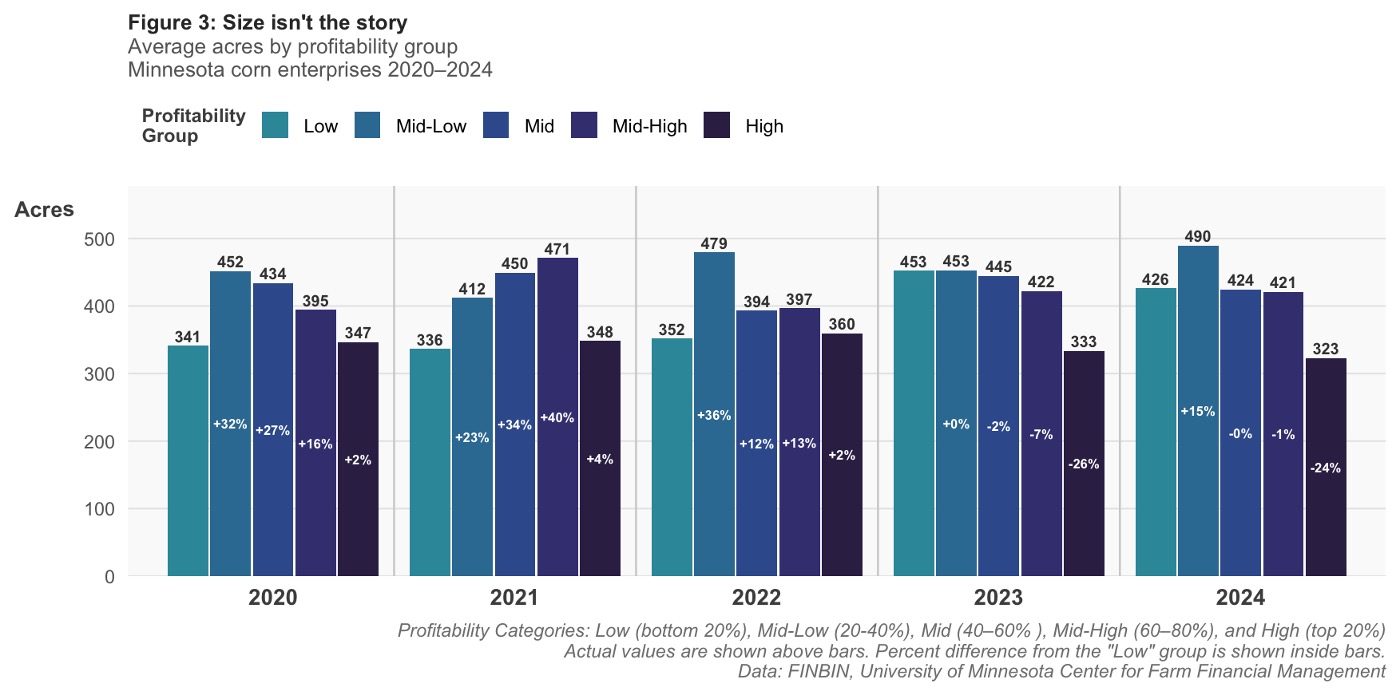
Figure 3: Size (acres) of Minnesota corn enterprises (2020-2024), broken out by profitability group.
Soybeans tell a similar story
For soybeans, yield again emerges as the dominant factor (Figure 4) – and in many cases, the spread between low and high-profit farms is even more pronounced than in corn. Differences in soybean yields across profitability groups are large and consistent across years, driving a substantial share of the gap in returns per acre.
In contrast, differences in price received for soybeans are generally smaller than in corn. While higher-profit farms still tend to receive slightly better prices, the range is tighter. As a result, yield accounts for a larger share of the profitability differences in soybeans, while marketing plays a somewhat smaller – though still important – role.
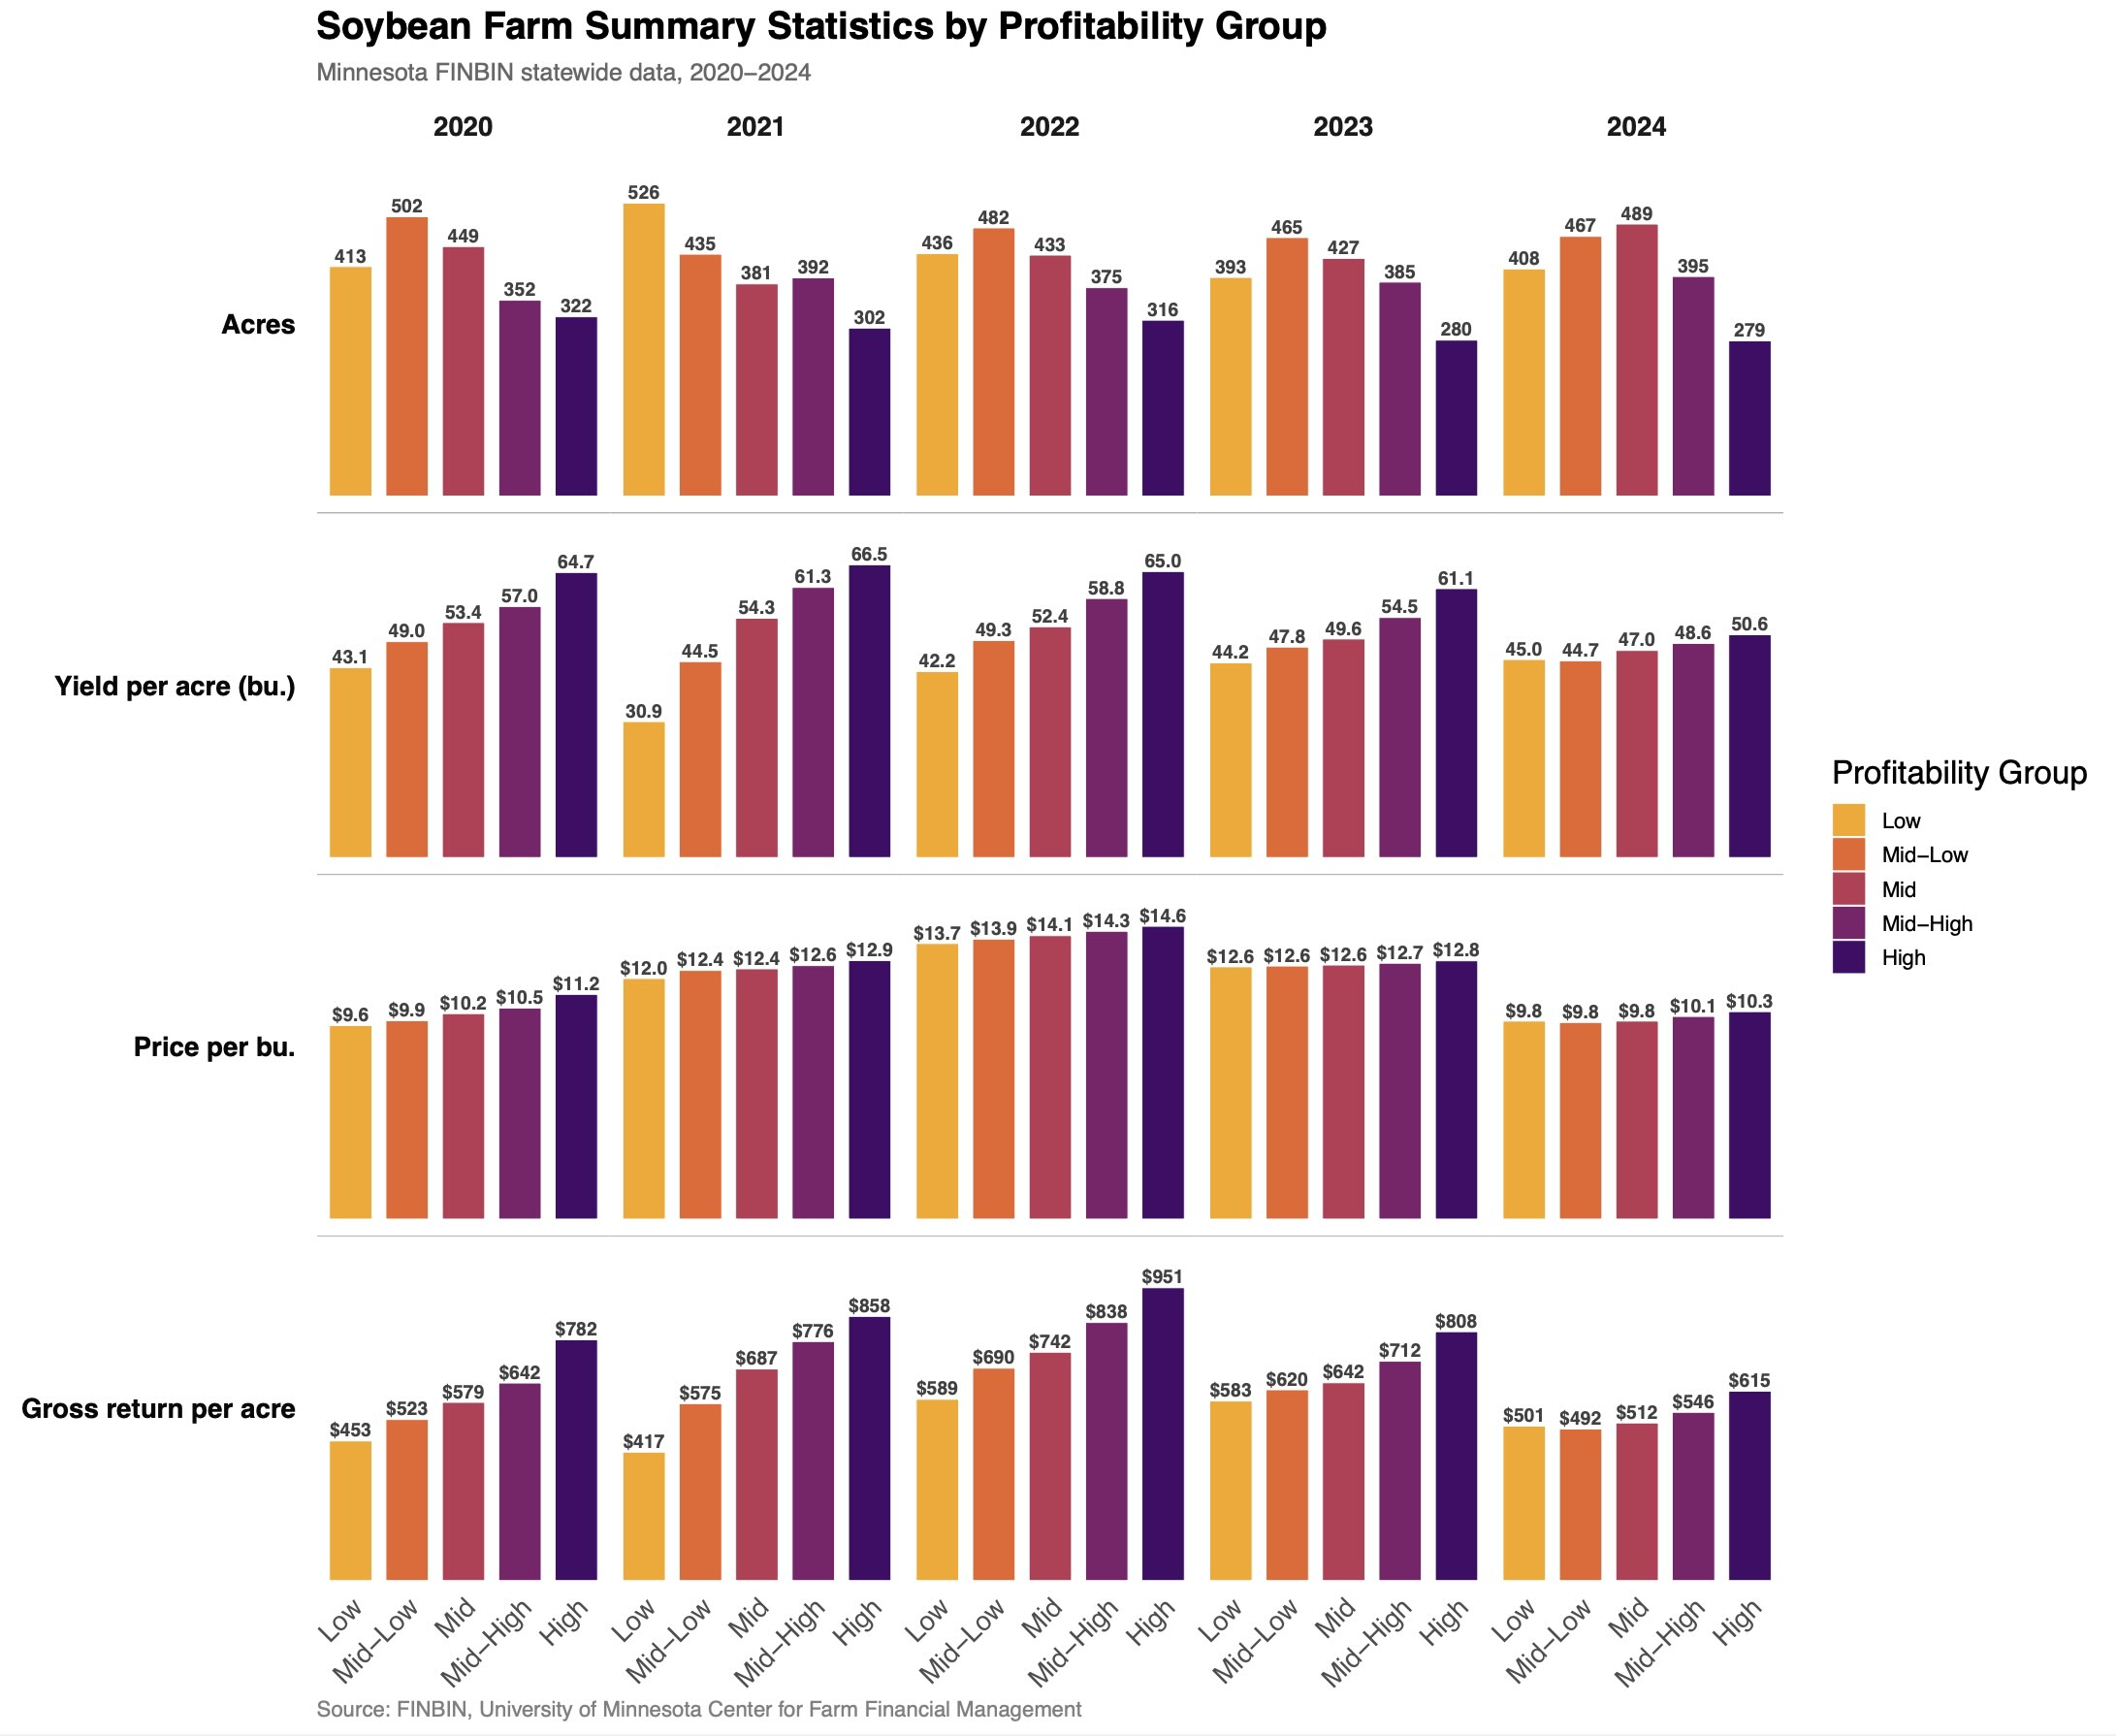
Figure 4: Minnesota Soybean Enterprises: size (acres), yield (bu/ac), Price ($/bu), and gross returns per acre ($/ac) for (2020-2024), broken out by profitability group
In summary and what questions remain
Taken together, these results point to yield as the primary driver of profitability, followed by price, while size plays a much smaller role. Not all of these factors are within a producer’s control – weather, soil, and location matter. Nonetheless, the consistent differences across farms suggest management decisions still play a meaningful role. In a tighter-margin environment, the corn and soybean farms that perform best are not necessarily the biggest, but those that execute well where it counts – maintaining strong yields, capturing better prices, and allocating resources effectively.
This is the first blog post analyzing Minnesota’s FINBIN data and it is only scratching the surface of what this dataset can help us understand. These results are about the revenue side. But a farm’s profitability is also shaped by what it spends – input costs, labor, land, equipment. This will be the subject of Part 2, which will look at the cost side of the FINBIN data: what high- and low-profit farms spend differently, where the efficiency gaps are, and what cost-per-bushel looks like across quintiles. And of course, Minnesota farmers operate across different scales and types of production. If you have questions or thoughts about what future analysis could help us understand, please do reach out.